
How to read a volcano plot
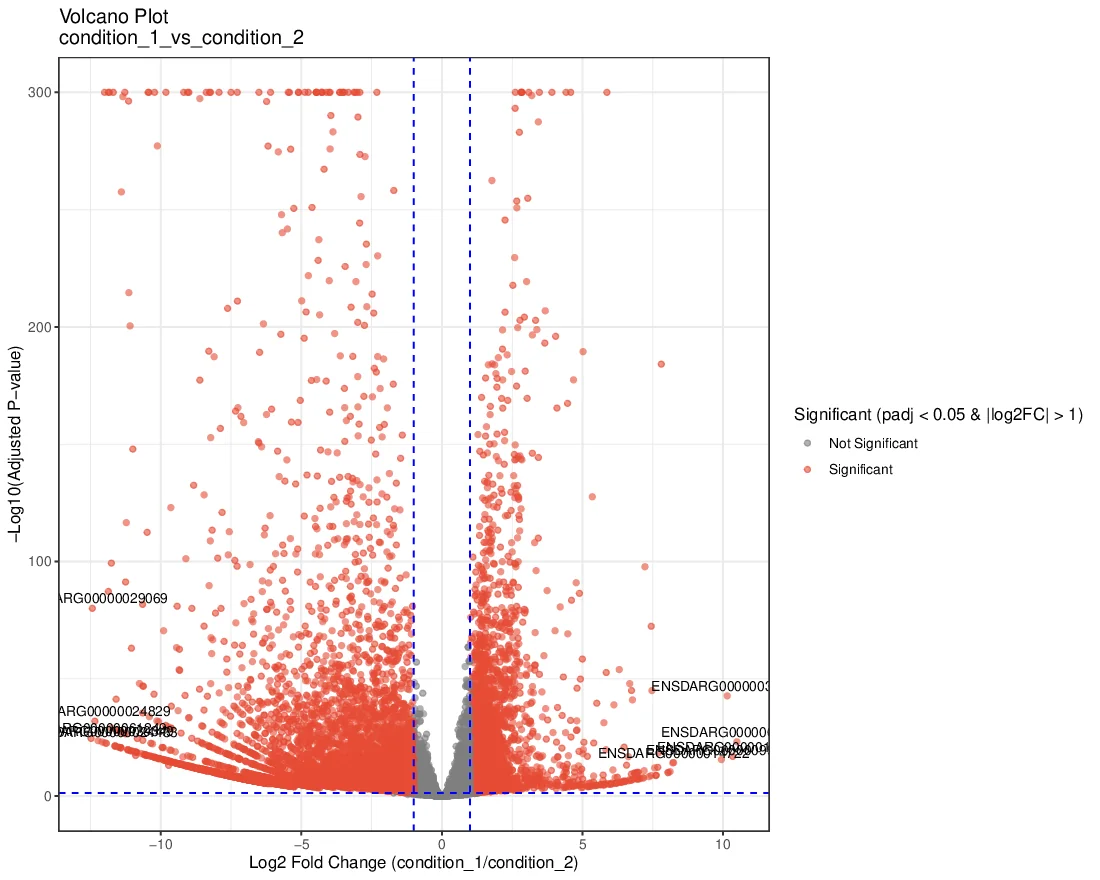
A volcano plot puts each gene from a differential expression comparison on one chart. Read it from left to right for the direction and size of the change, then from bottom to top for statistical evidence.
Read the axes first
- Horizontal: log2 fold change. Zero means no estimated difference. In this example the label is condition_1/condition_2, so right means higher expression in condition_1 and left means higher expression in condition_2. A log2 change of +1 is a twofold increase; −1 is a twofold decrease. Always check the contrast order before calling a gene up- or down-regulated.
- Vertical: −log10(adjusted p-value). Higher points have smaller adjusted p-values and stronger statistical evidence against no difference. An adjusted p-value of 0.05 appears around 1.3 on this scale. The adjustment accounts for testing many genes; it is not the same as a raw p-value.
Read the thresholds and colors
The dashed vertical lines mark log2 fold changes of −1 and +1; the horizontal line marks adjusted p-value 0.05. In this example, red means a gene passes both thresholds: adjusted p-value < 0.05 and |log2 fold change| > 1. Gray means it does not pass both. A point high but near zero can have strong statistical evidence for a small change, while a point far left or right but low on the chart has a large estimated change without enough evidence at these cutoffs.
Before drawing a conclusion
- Check sample quality and the comparison design first. Outliers, batch effects, or an unintended contrast can change the apparent gene list.
- Inspect the results table for a gene's exact fold change, adjusted p-value, and expression level. Low-count genes can have unstable fold-change estimates; a point alone does not establish biological importance.
- Use the plot to choose genes to investigate, not as proof of a mechanism or a diagnosis. Compare patterns with the MA and PCA plots and the underlying data.