See what a Bridge Horizon report looks like
These are real outputs from our single-cell RNA-seq and differential expression pipelines. Every plot is publication-ready, downloadable for your slides and papers, and backed by a fully traceable run.
Report 1
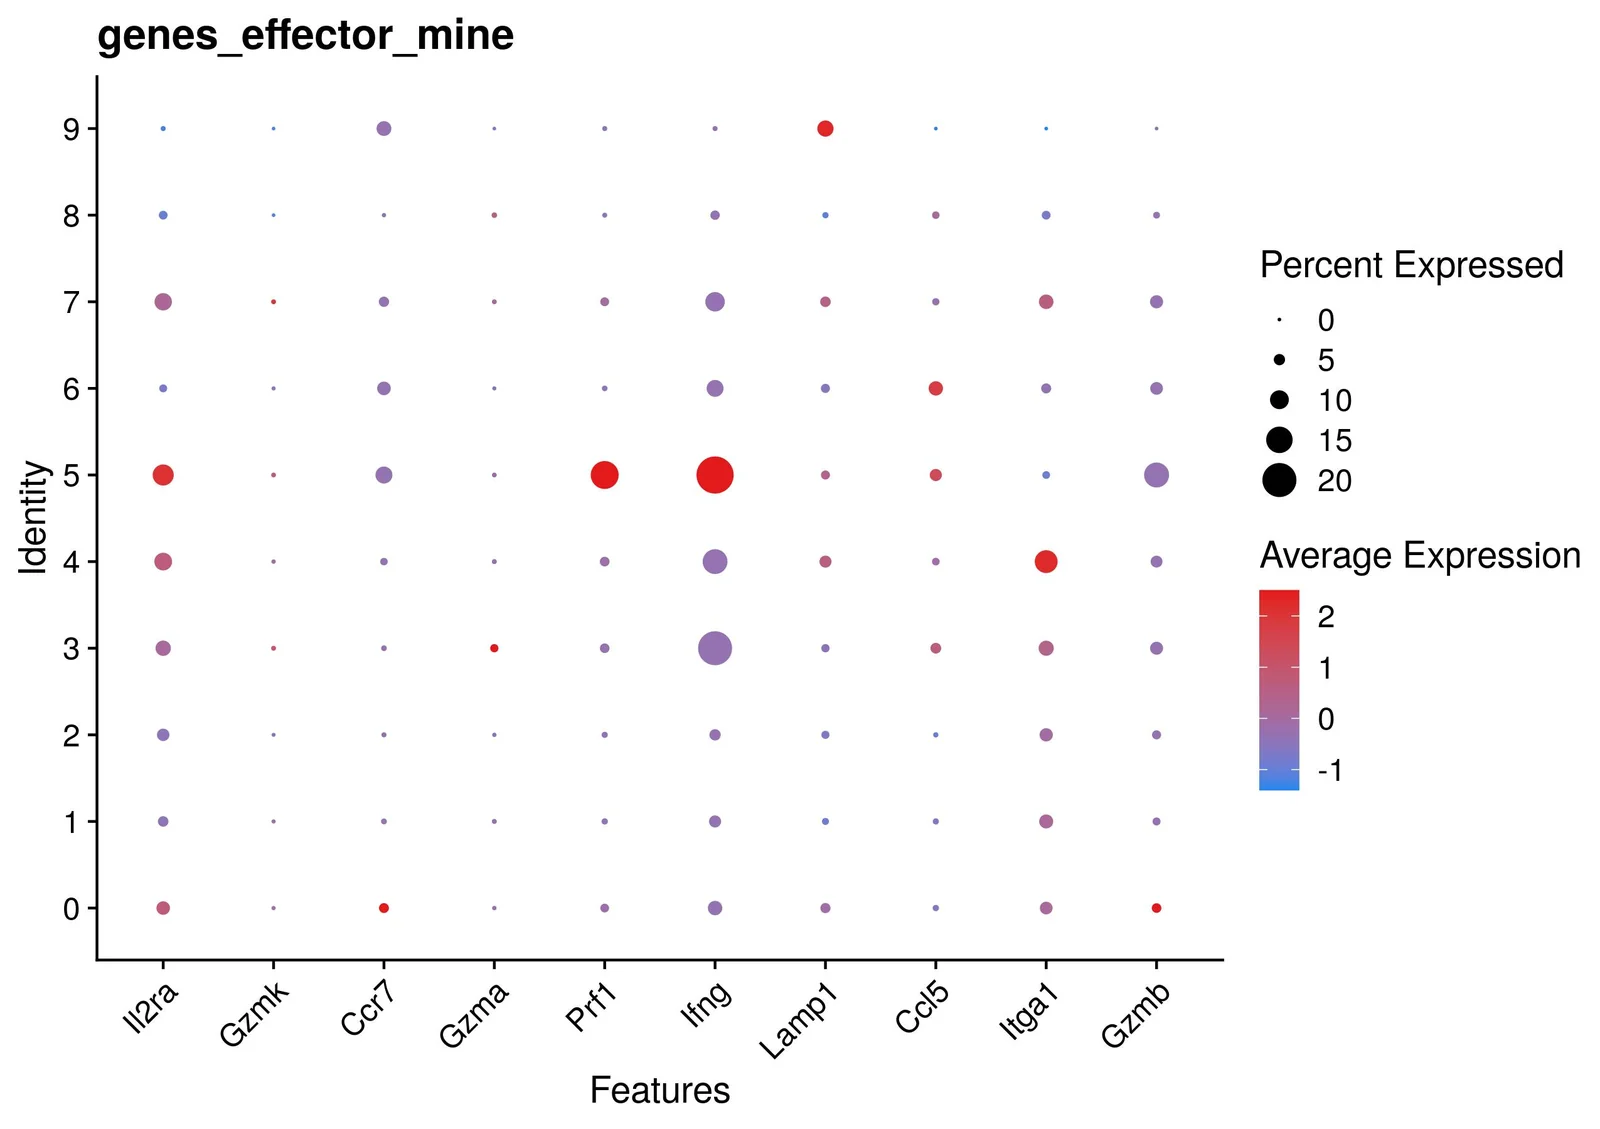
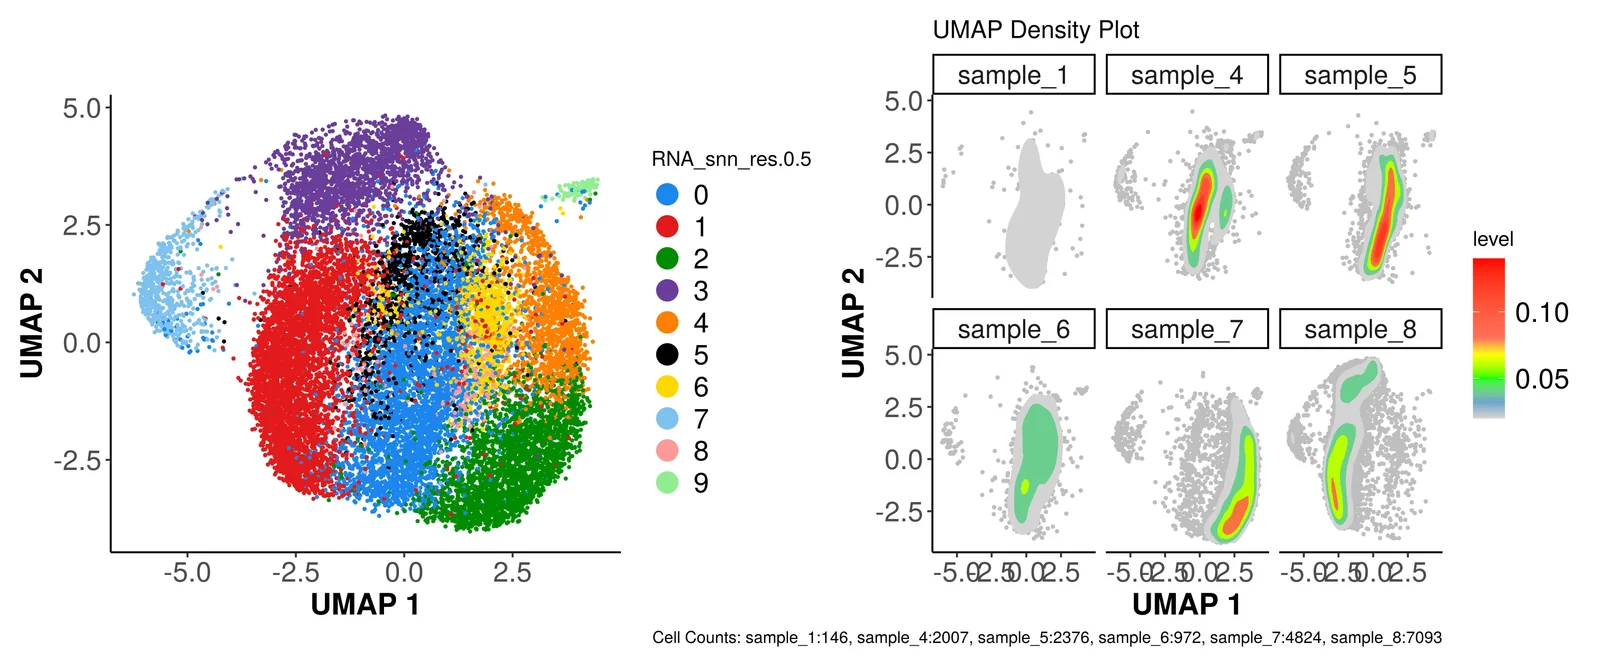
Single-cell RNA-seq summary report
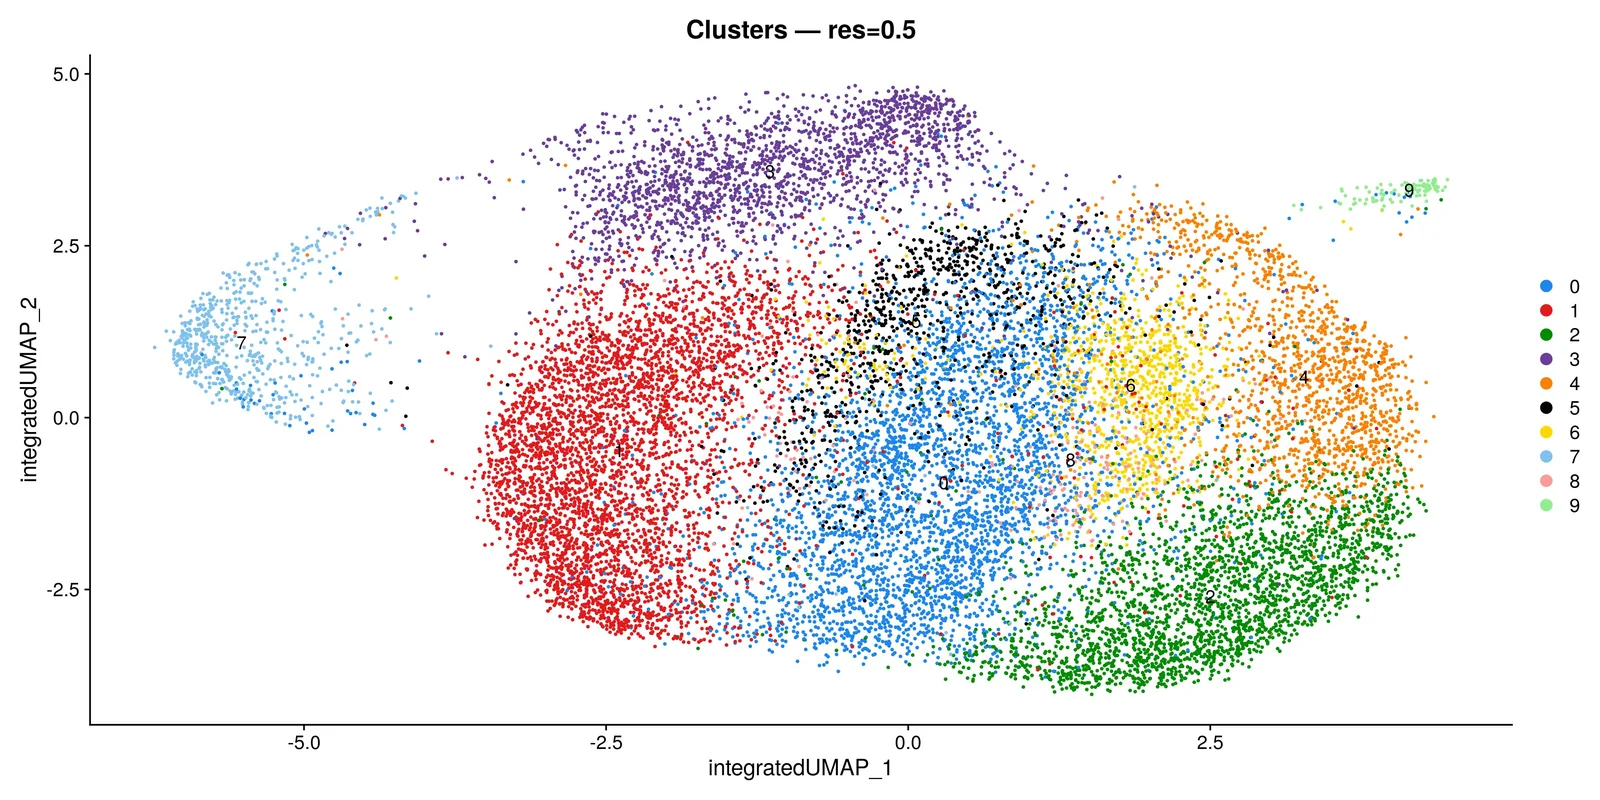
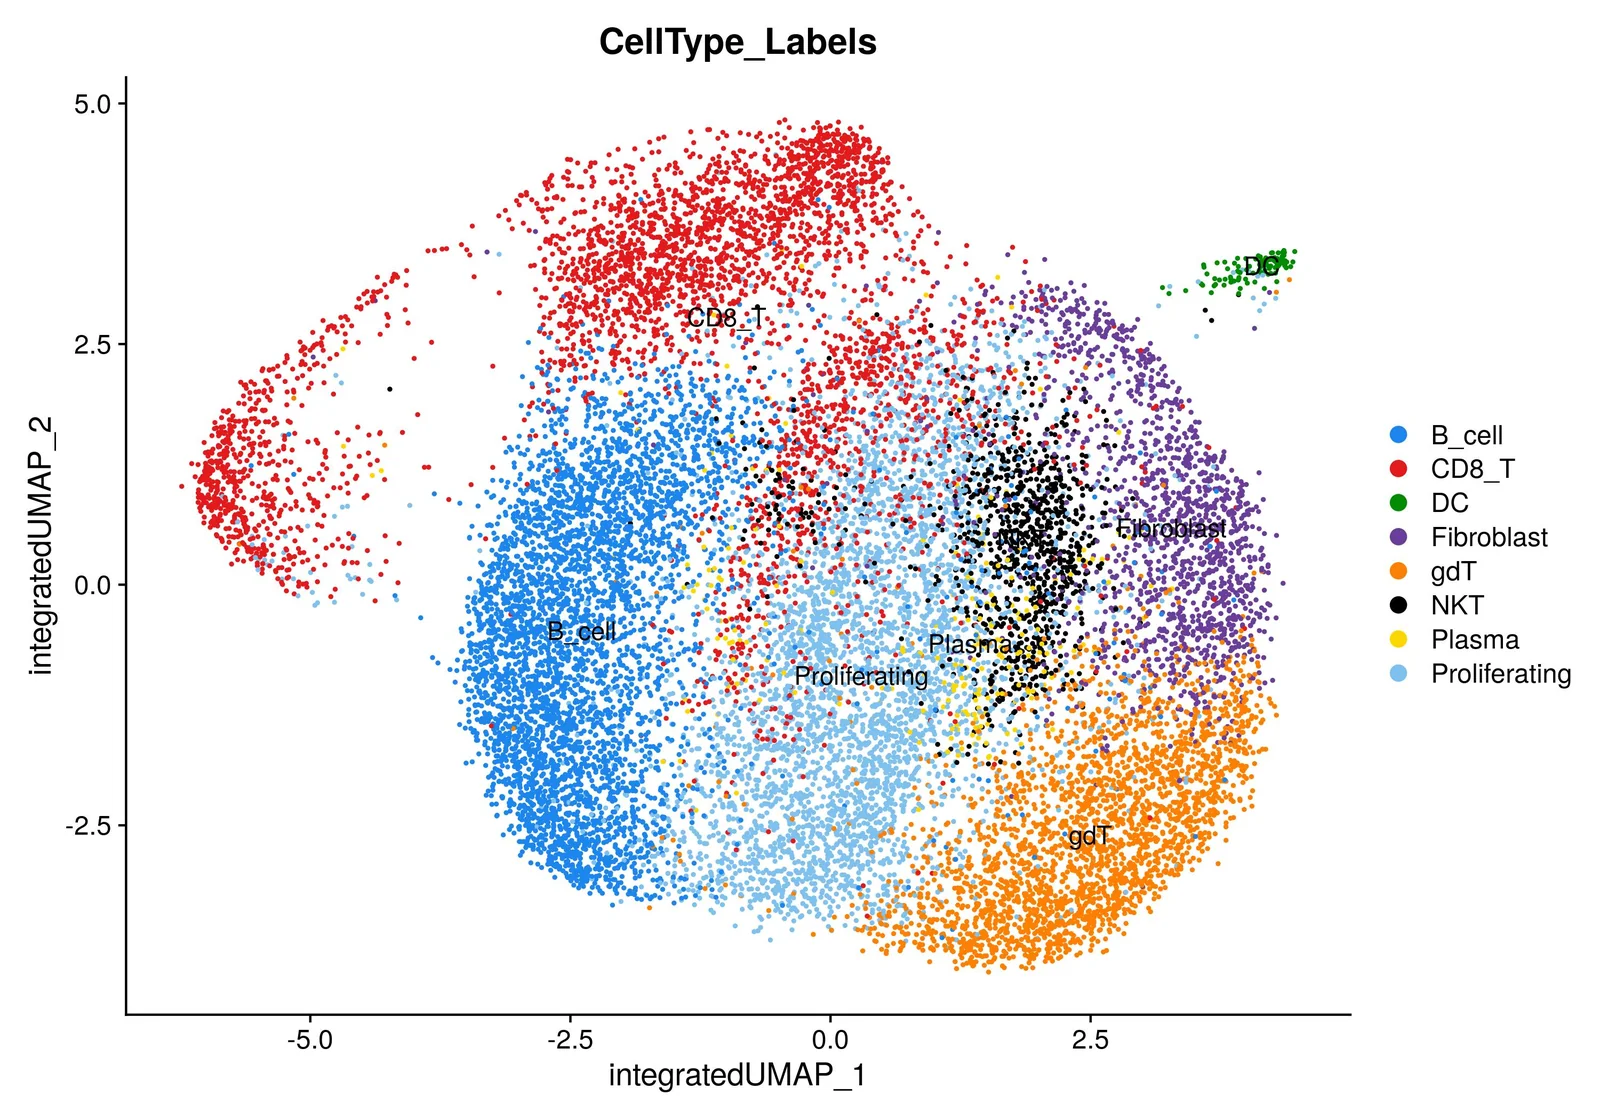
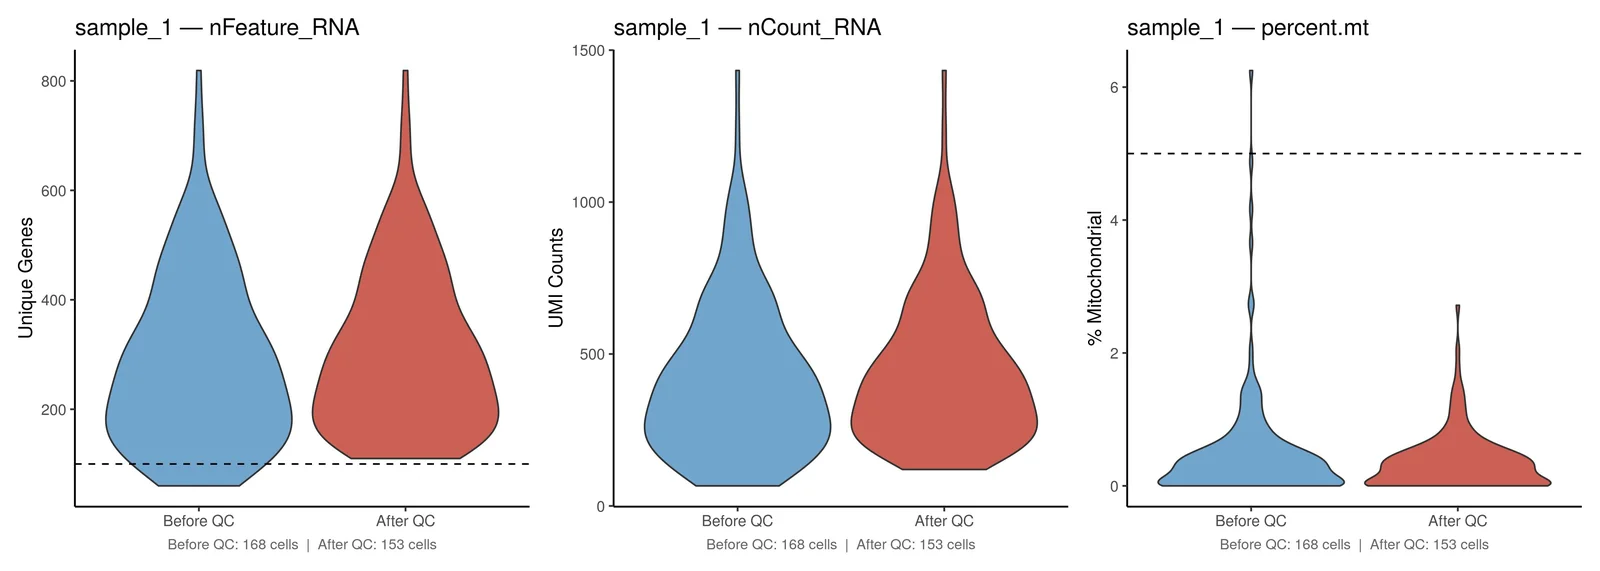
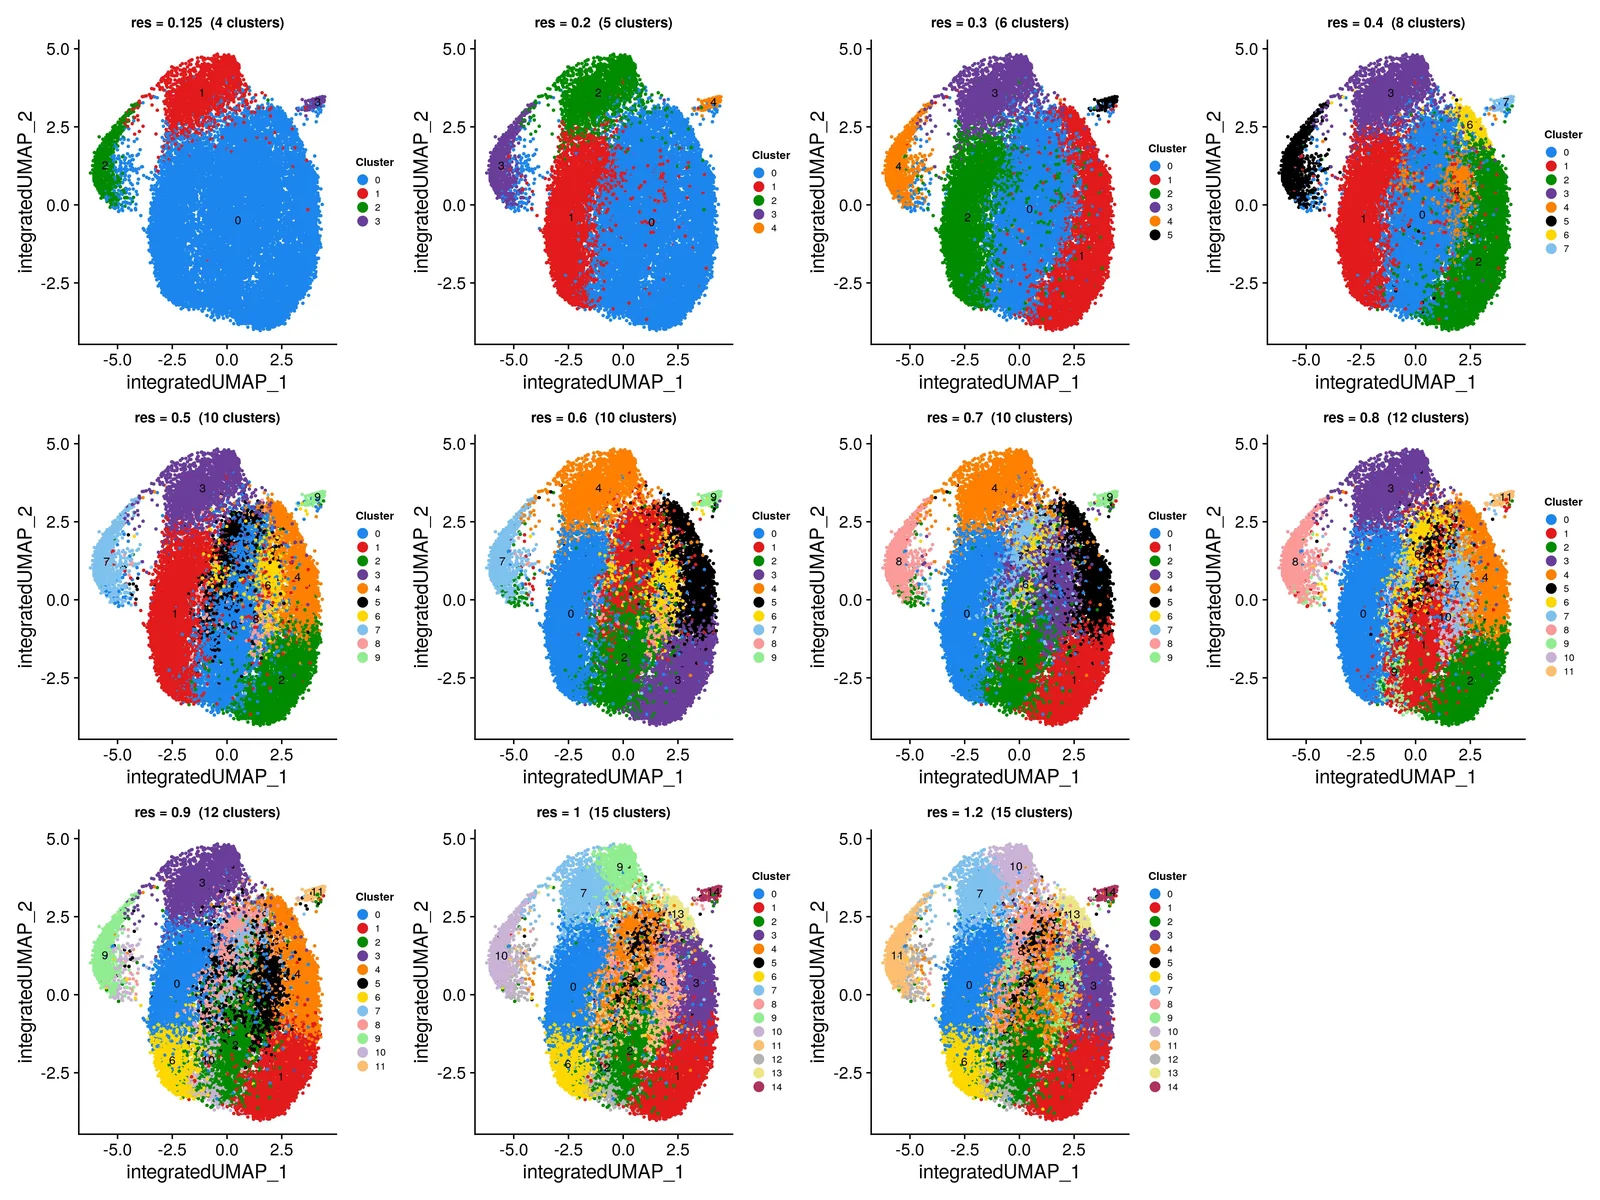
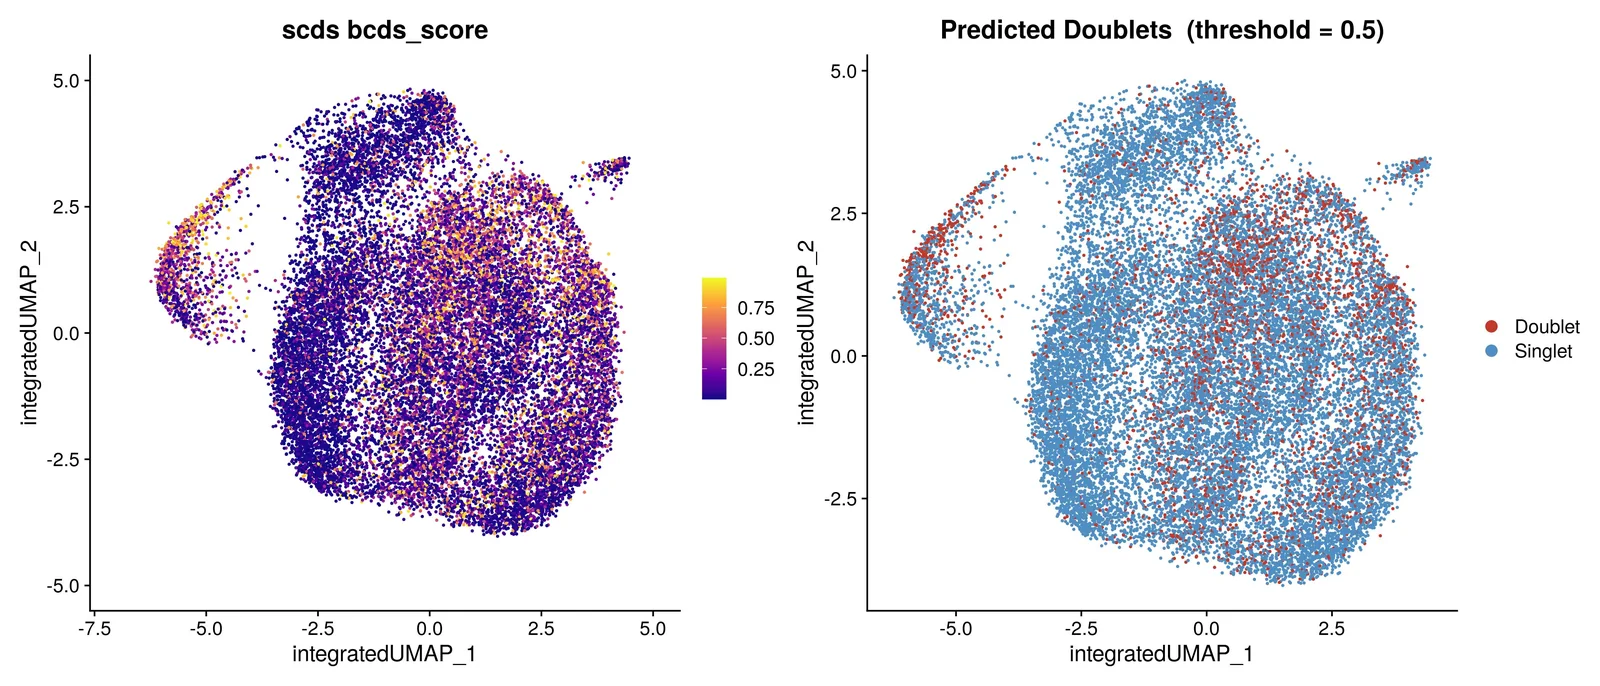
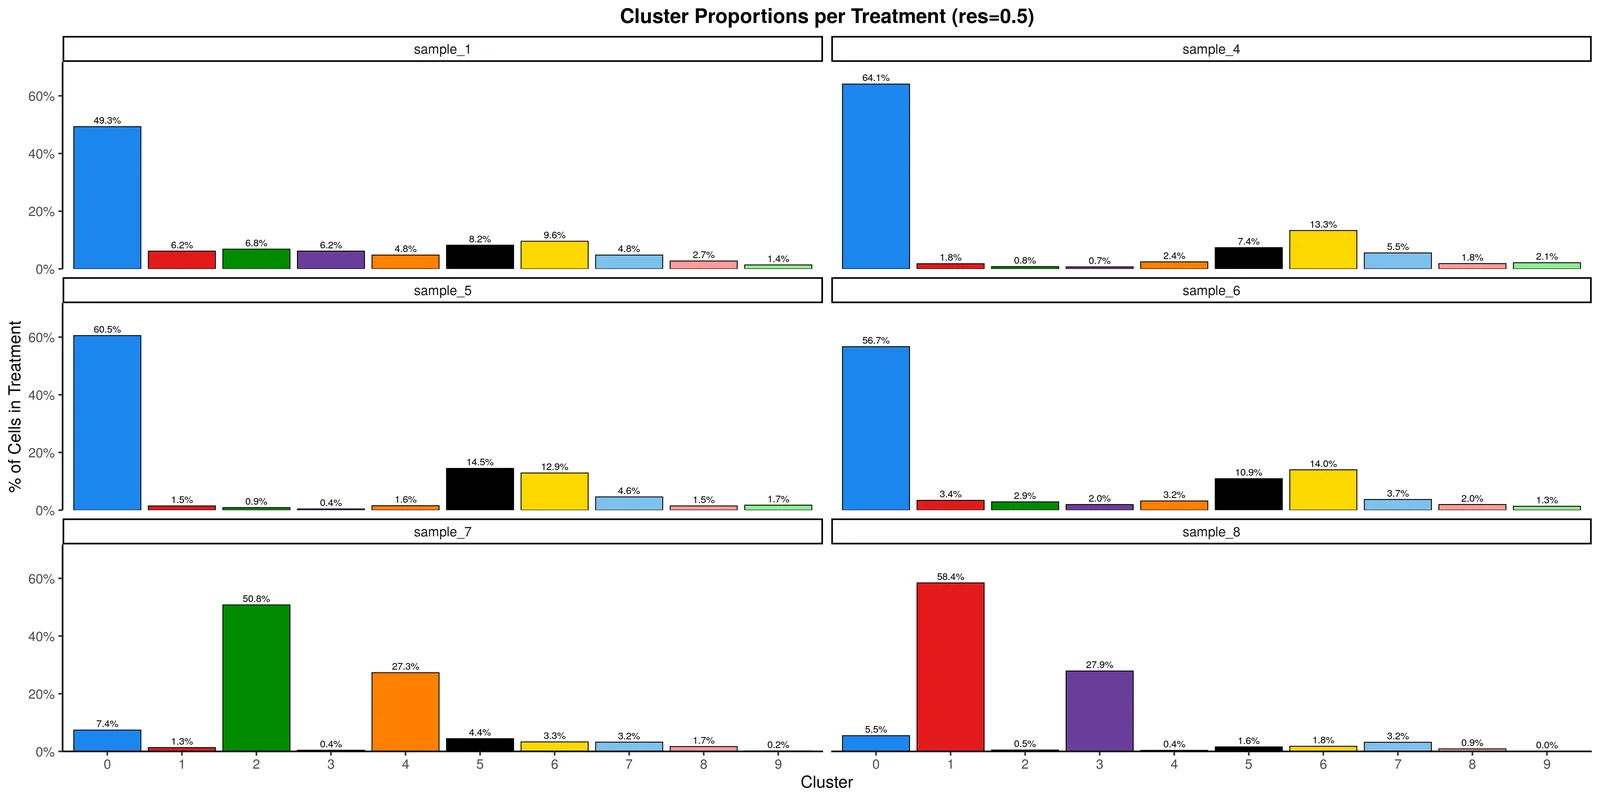
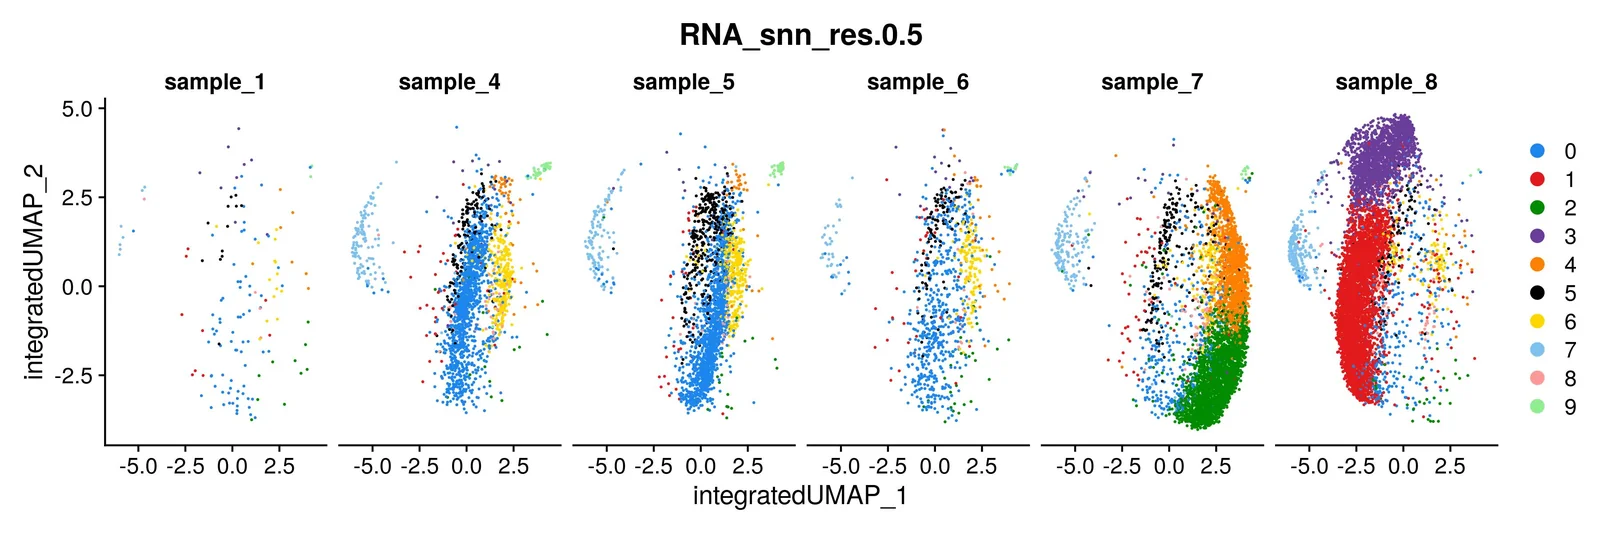
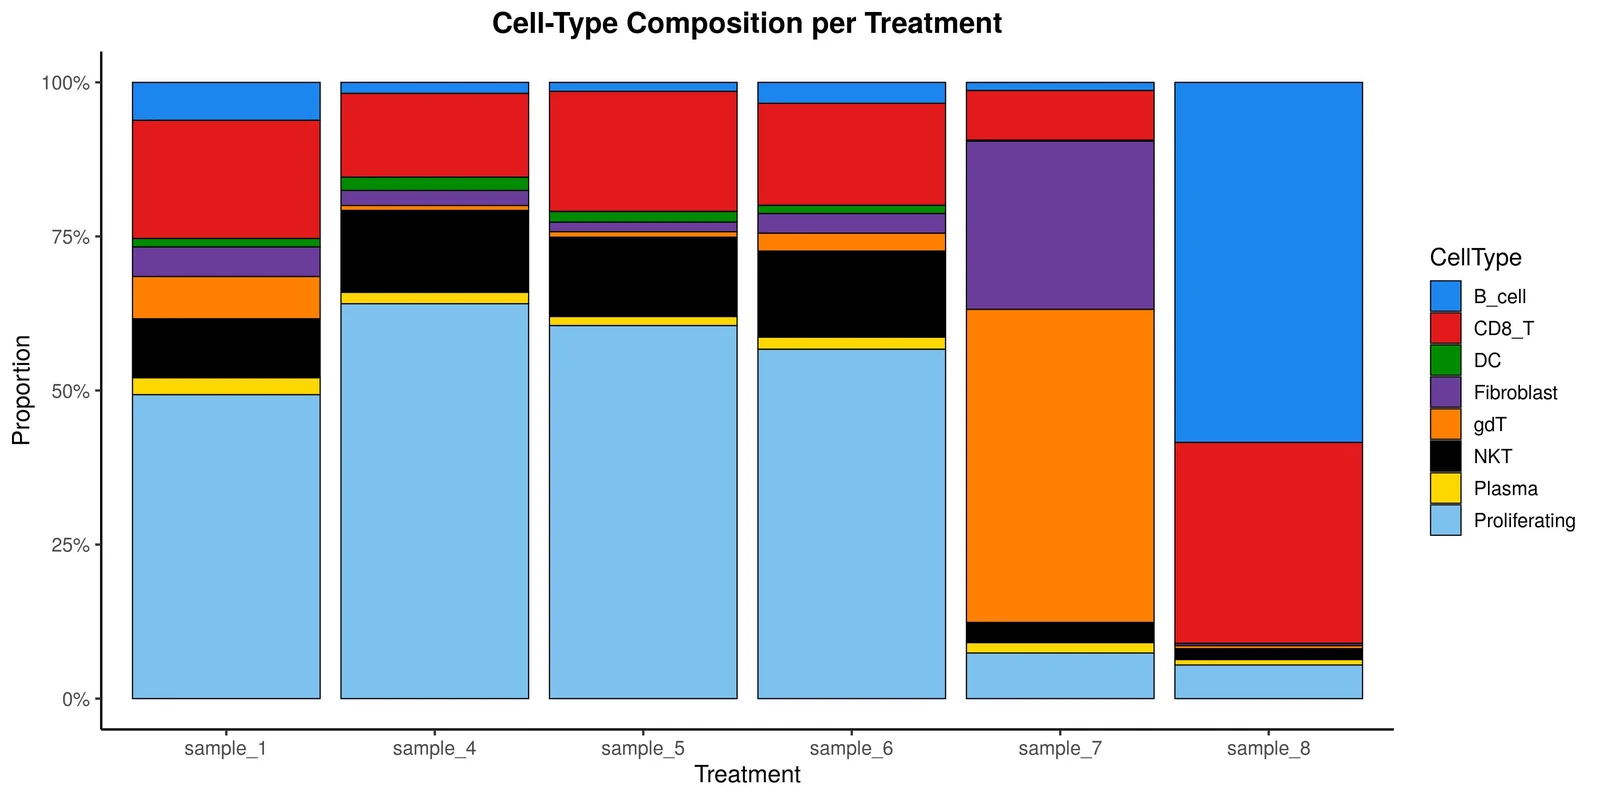
This is the summary report every single-cell run produces on Bridge Horizon. It walks from quality control through integration, clustering, doublet detection, and cell-type annotation, with each plot rendered at publication quality.
In the interactive version, your team clicks any plot to download a static image for presentations and publications, and every figure links back to the exact run, parameters, and pipeline version that produced it.
 Download
 Download
 Download
 Download
 Download
 Download
 Download
 Download
 Download
 Download
Report 2
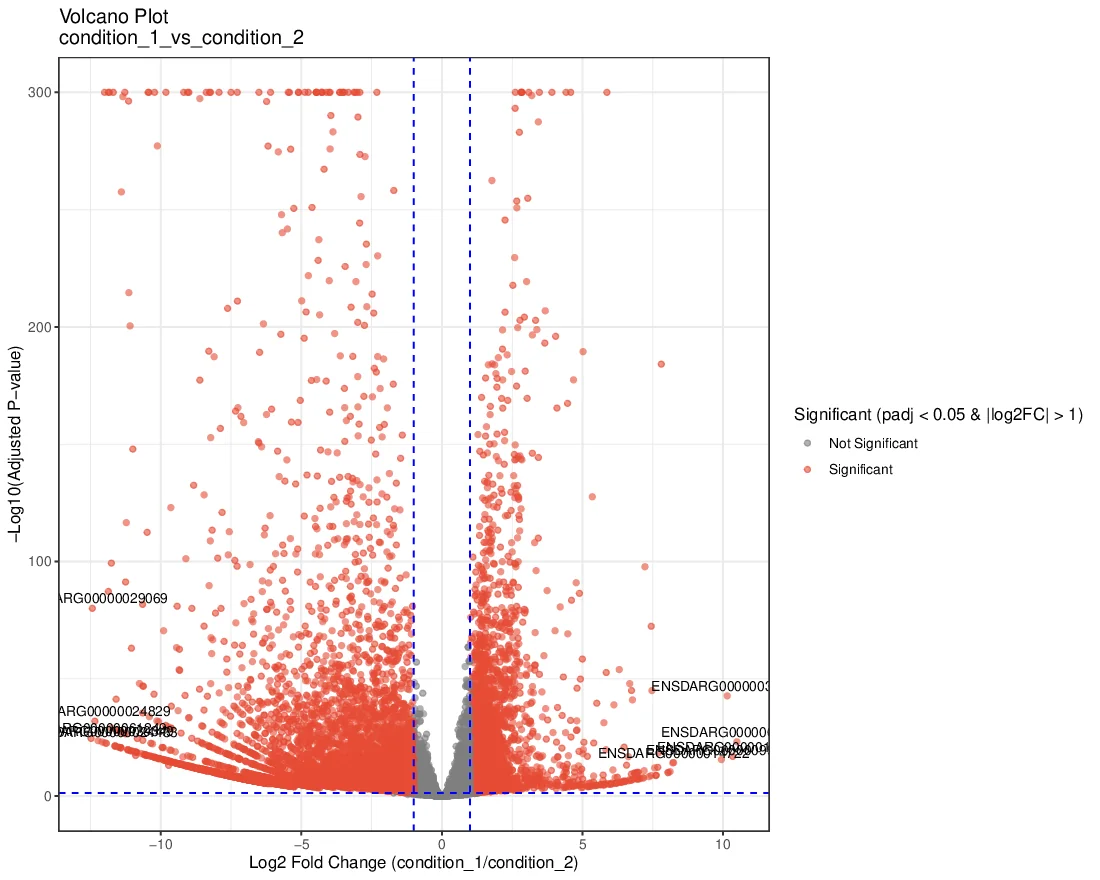
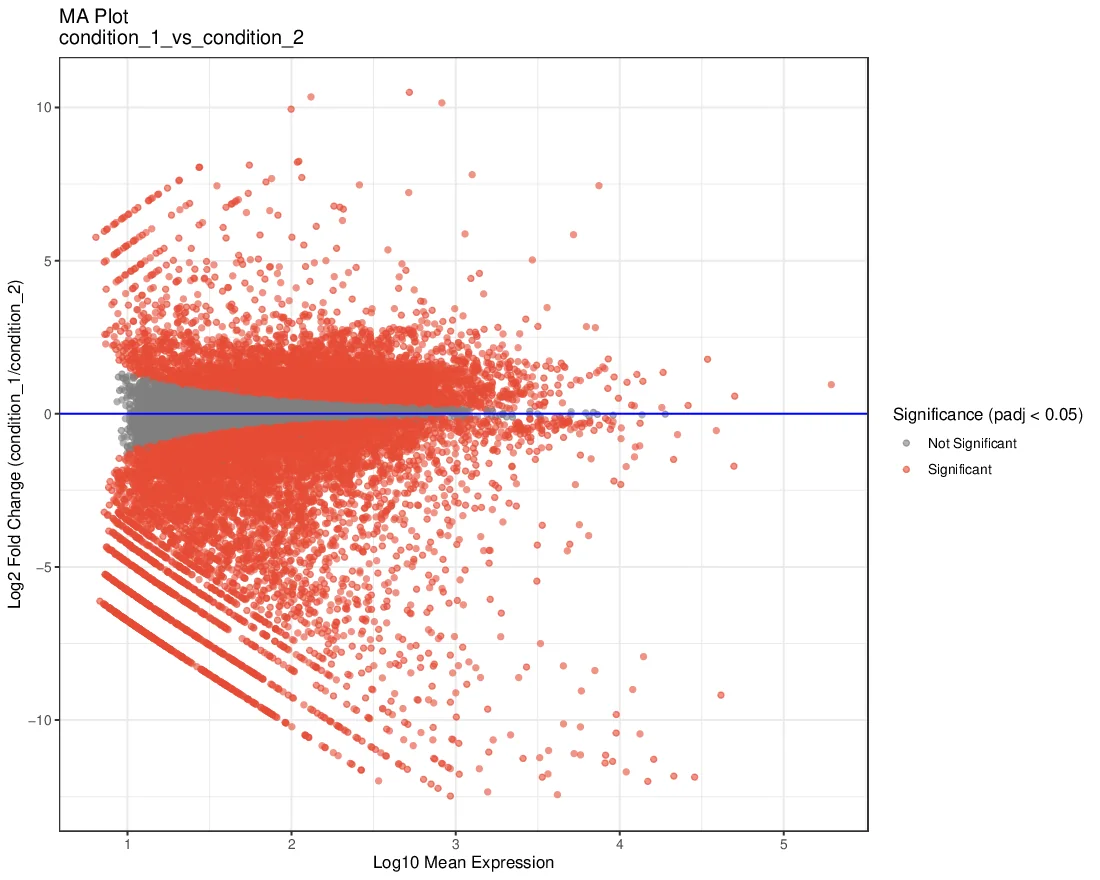
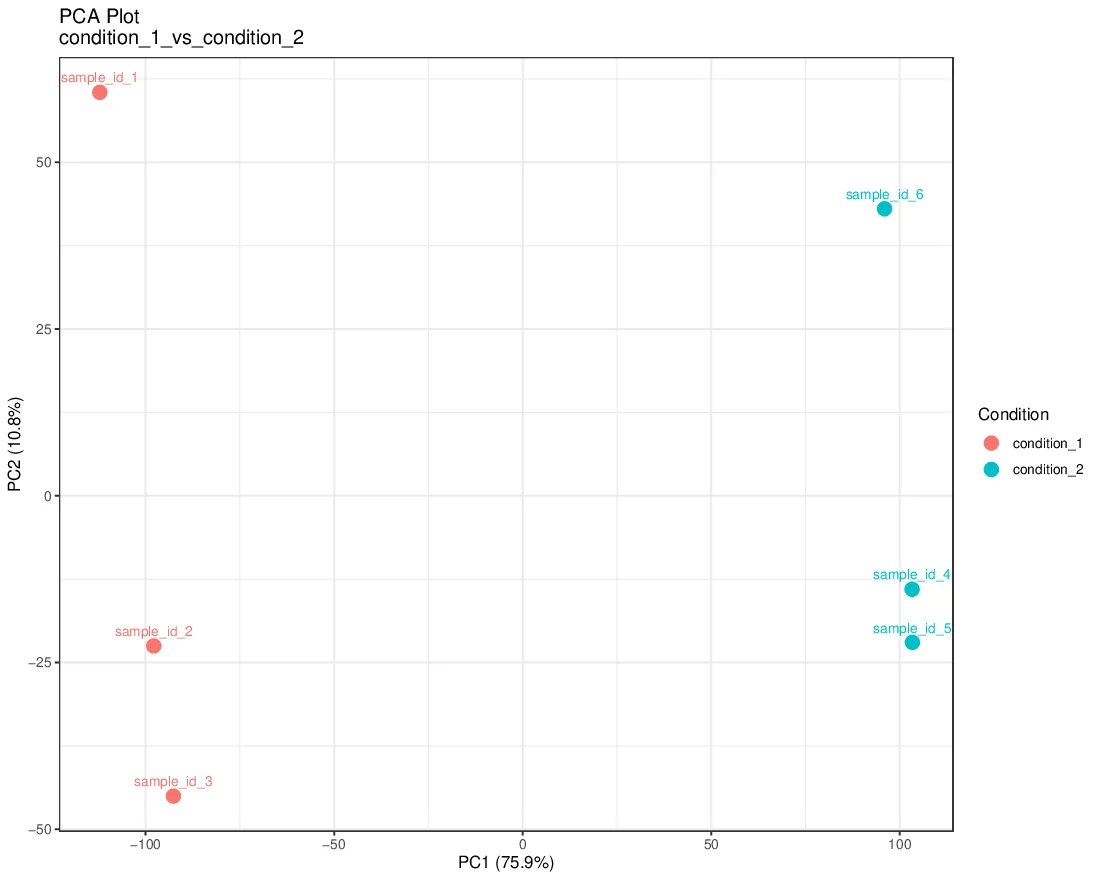
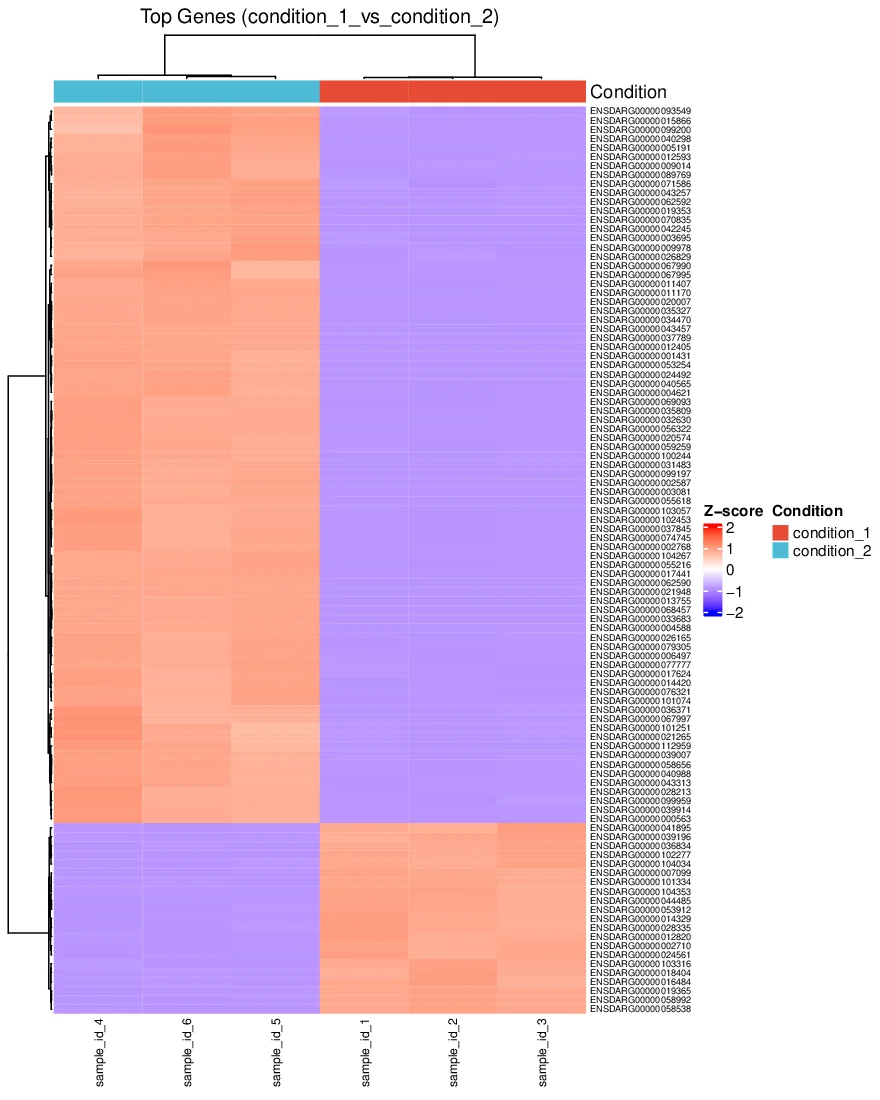
Differential expression report: condition 1 vs condition 2
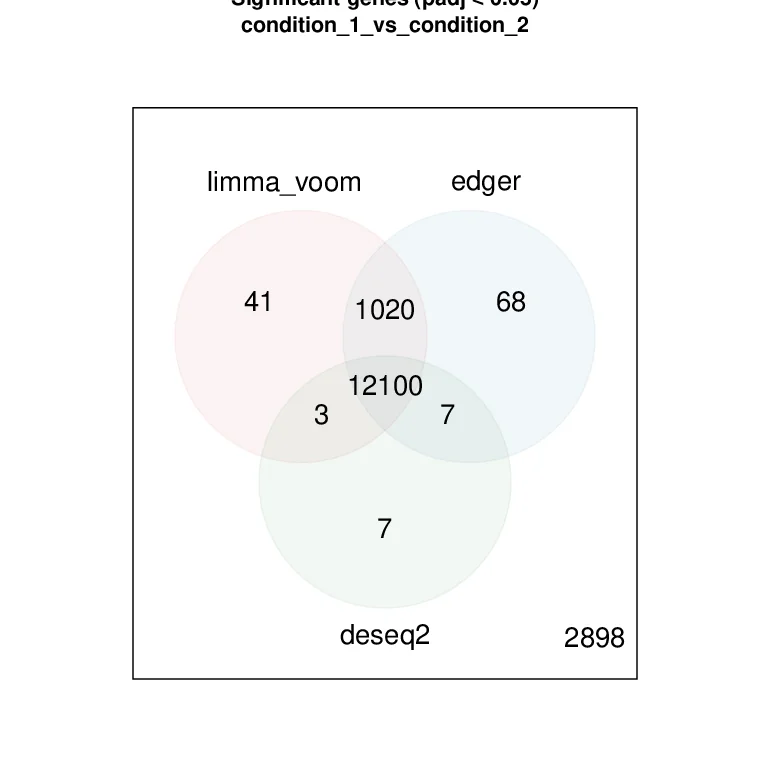
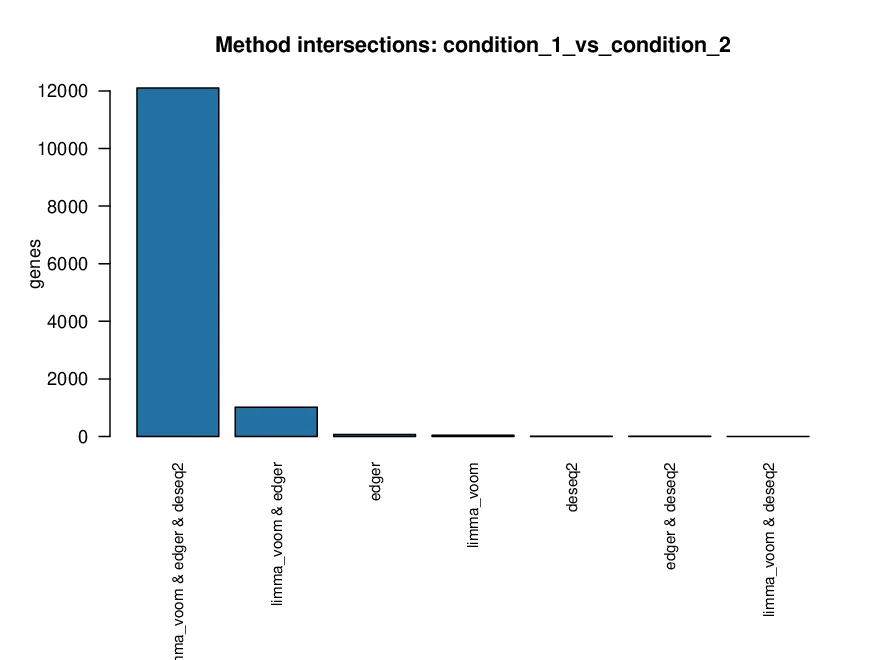
When you compare conditions, Bridge Horizon runs DESeq2, edgeR, and limma-voom on the same counts and reports where they agree. Instead of betting your conclusions on a single method's assumptions, you see the consensus, and exactly where the methods disagree.
Every figure is downloadable, and the full run is reproducible: design formula, contrasts, cutoffs, and package versions are all captured automatically.
 Download
 Download
 Download
 Download
 Download
 Download
Need a report like this on your own data?
Run it yourself on Bridge Horizon, or have our team produce it as a service. Either way you get the same traceable, publication-ready output your whole team can explore together.
See how Horizon fits your team.
Built on production genomics experience since 2020, Horizon makes every dataset, pipeline run, and parameter shared and traceable across your entire team.